How To Create Custom Maps using Google Maps
In this tutorial, you’ll learn how to create a map using Google Maps; how to customize that map manually or by importing data from a spreadsheet; and how to publish it on your site.
Create a basic map
Start by heading to maps.google.com.
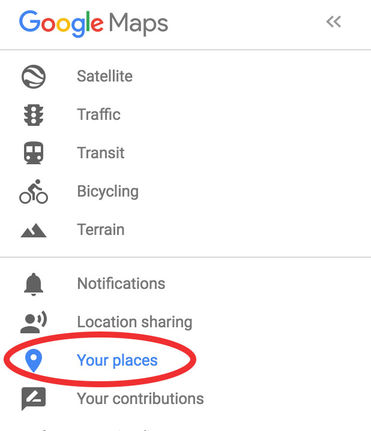
Click on the menu icon on the top left hand side of the screen and select “Your Places.” (The menu icon is just to the left of the search bar on the top left hand side of your screen.)
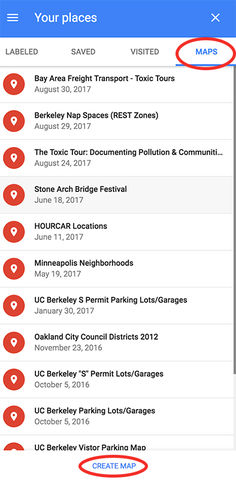
Select the maps tab. Navigate to the very bottom of that window and select “Create a Map.”
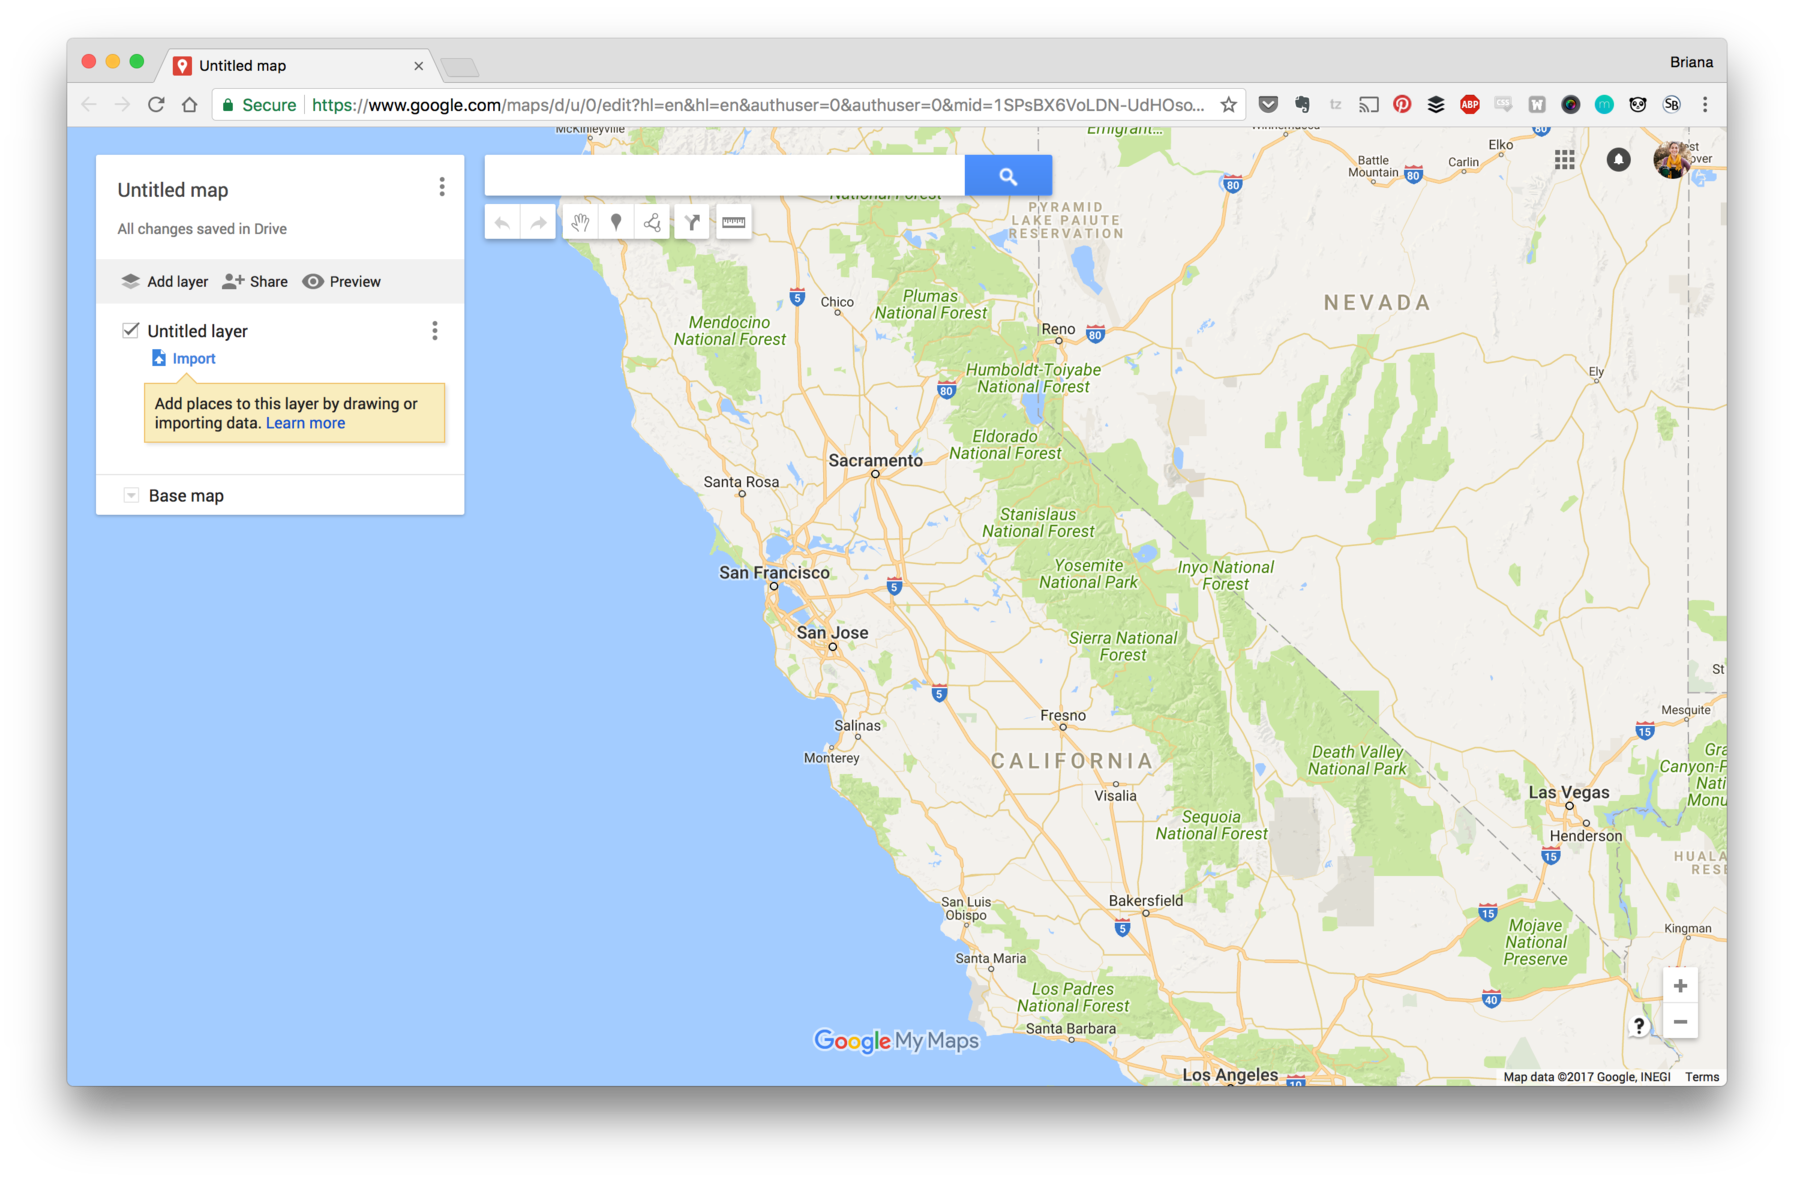
This will open a map in a new tab that you can customize in one of two ways: by drawing points and shapes manually or by importing a spreadsheet.
Customize your map by drawing
Let’s start by drawing – that is, manually creating points or shapes – on your map.
Add a Marker
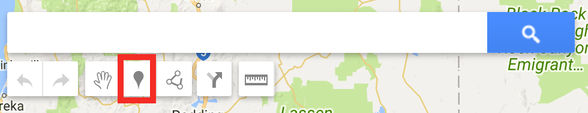
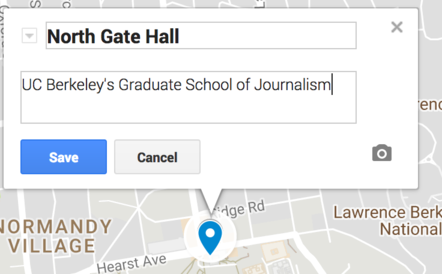
To create points on your map, simply select the “Add Marker” tool near the search bar, then click the place on your map where you want the point to go.
Give your point a title and a description when prompted, if you’d like.
You can adjust the color and the icon style for the point you just created by clicking on the paint bucket icon. This will show you various color and icon options.
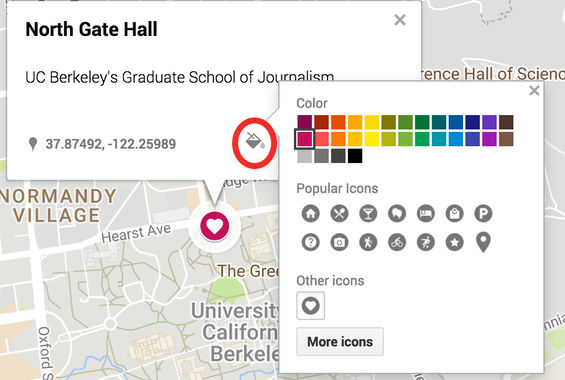
By default, Google will show you its most popular icons, but there is also a whole icon library that you can explore by clicking “More Icons.” (You can also import a custom icon from the web, using resources like the Noun Project.)
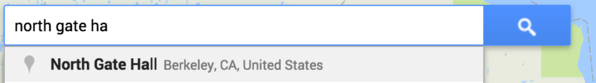
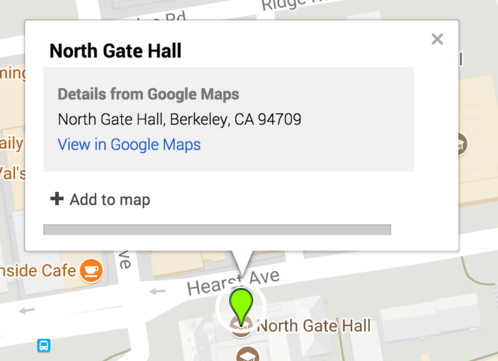
Another way to add a marker to your map is by searching for your desired location. When your searched location appears in the pop-up window, click the “add to map” button to create the new marker on your map.
Create Lines and Shapes
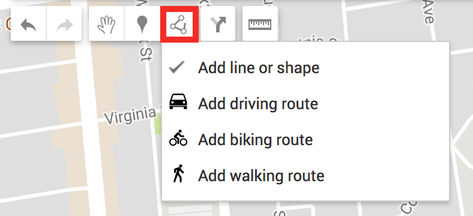
You can also create lines or shapes on your map as well by clicking the “Draw a Line” tool. You’ll see several options from the dropdown menu, including ones for creating driving, biking, and walking routes. For the moment, let’s just use the “Add a line or shape” tool.
To create a line, simply click along the map where you want your line to be.
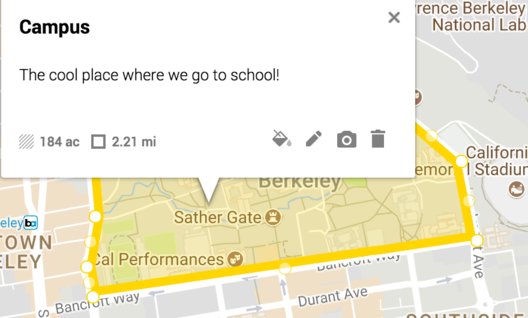
To create a shape, click along the map and be sure to connect the dots to create an enclosed shape.
Just like a marker, you can add a title and description to your line or shape. Once you hit save, you can also adjust its color, line or border weight, and transparency by clicking on the paint bucket.
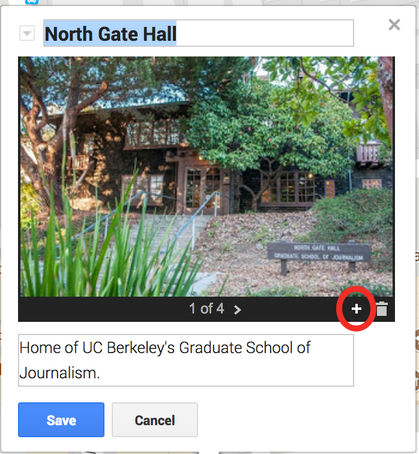
Add a Photo or Video to Your Map
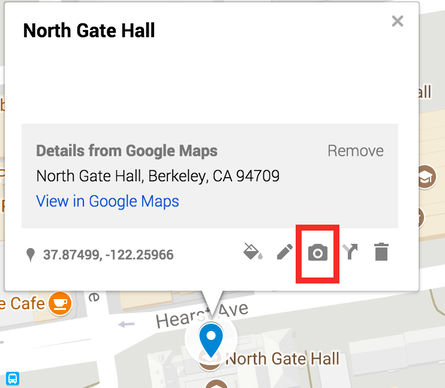
You can add a photo or a video to any marker, line or shape that you create on your map. To do so, click on your marker or shape and find the photo icon.
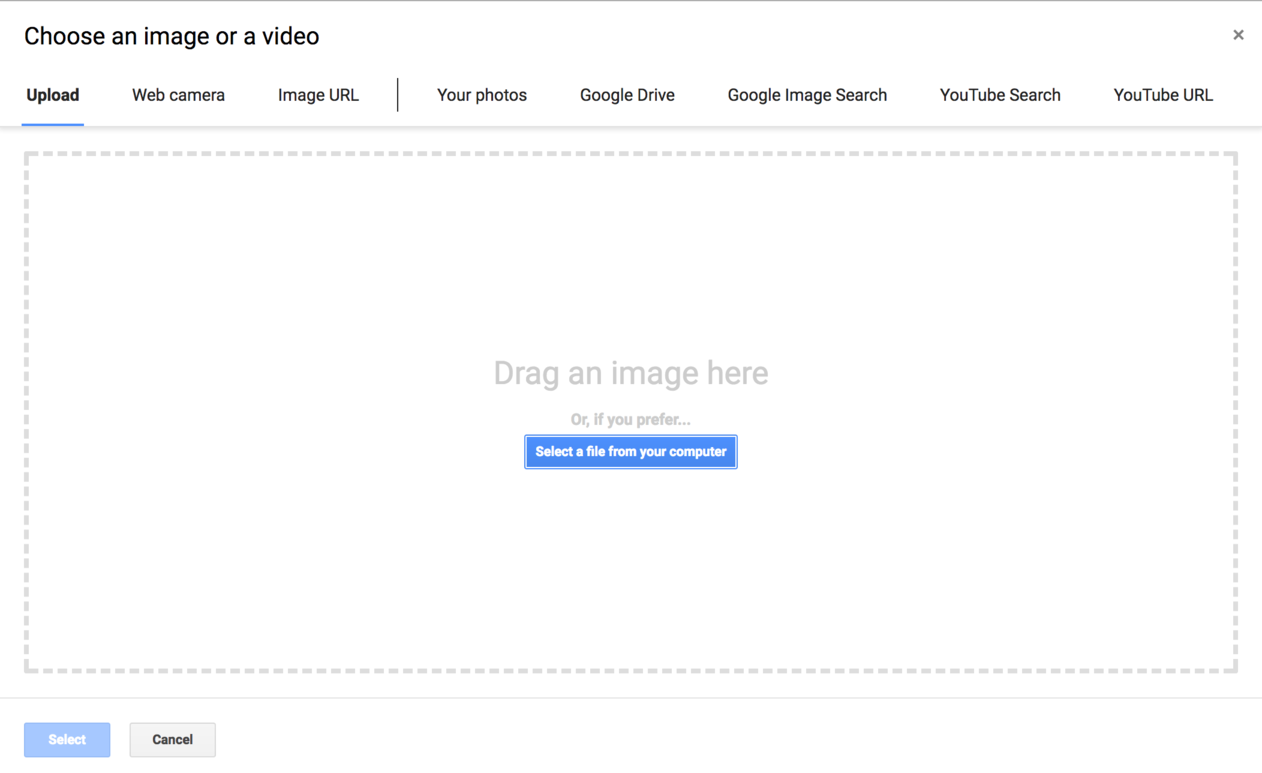
A popup window will appear and you’ll see several options that allow you to:
1) Upload a photo file from your computer or from your Google Drive
2) Take a photo with your web camera
3) Add an image from the web via url or via Google Image Search
4) Add a YouTube link via url or via search
Once you’ve chosen an image or video link you’d like to use, hit save and it will be added to your marker or shape. You can also create a gallery with multiple images and/or video links by clicking on the “+” button on the bottom right hand side before saving.
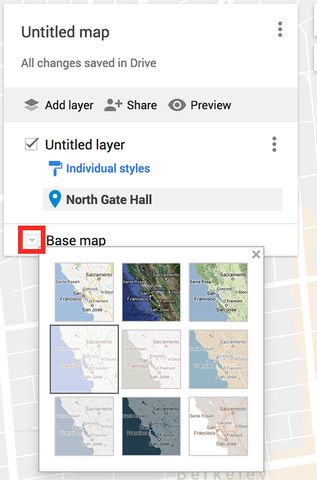
Customizing the base map
Take a look at the left hand side of your screen. You’ll notice a box that shows information about your map, as well as the the various layers that comprise it.
So far, all the changes we’ve made have been to a layer on top of the map that we see. But you can also change the style of the map itself. To do so, click the small arrow next to the “Base Map” layer. You’ll see several map styles from which you can choose.
Customize your map with data
We’ve learned how to customize our map by manually adding markers, lines and shapes. But say we have a ton of points that we want to add to the map. You could add each marker manually, but importing a spreadsheet would be faster.
For any map you make, you’ll want to have your data in a spreadsheet and you’ll need at least one column that contains location data. That location data can be a simple list of addresses; city, state, country information (e.g. “Oakland, California” or “Buenos Aires, Argentina”); or it can include latitude and longitude coordinates, separated by a comma (e.g. “37.8043637, -122.2711137”)
For this tutorial, let’s use the following sample data set of student hometowns to populate our map.
Before we add it to our map, let’s take a quick look at the data. The spreadsheet has 4 columns: one for the student’s name, one for their hometown, one for their assigned J200 course, and one for media concentration.
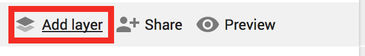
To upload the spreadsheet to our map, we’ll need to first create a layer by clicking “Add a layer” in the left hand box.
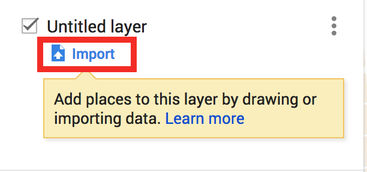
Under the new “Untitled Layer” you’ve created, click import.
Then find and select the Student Hometowns spreadsheet. (It will likely be in the “Shared With Me” or “Recent” tab.)
Google will prompt you to select the column that contains the location data. This is what Google will use to place the markers on the map. In our case, the location data is in the hometown column, so we’ll select that.
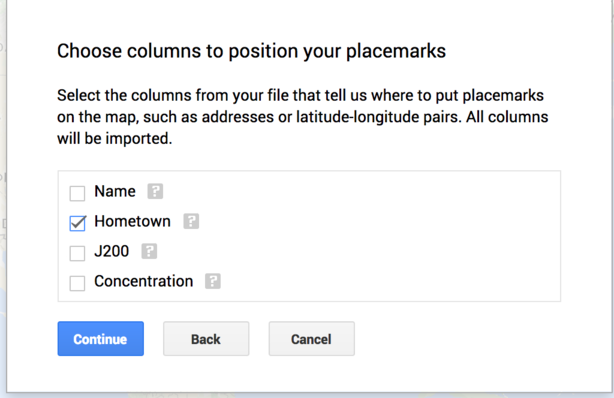
(If you had location data that contained latitude and longitude coordinates, you’d have an extra step here. Google would ask you to select the appropriate order of your coordinates: “latitude, longitude” or “longitude, latitude.”)
Then, Google will prompt you to select the title for your markers. In this case, we want student names to show up as our titles, so we’ll select the “Name” column.
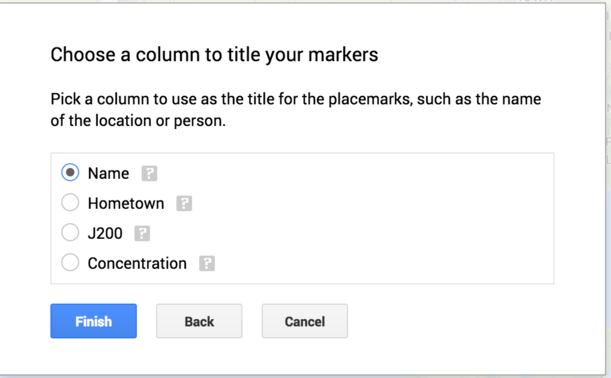
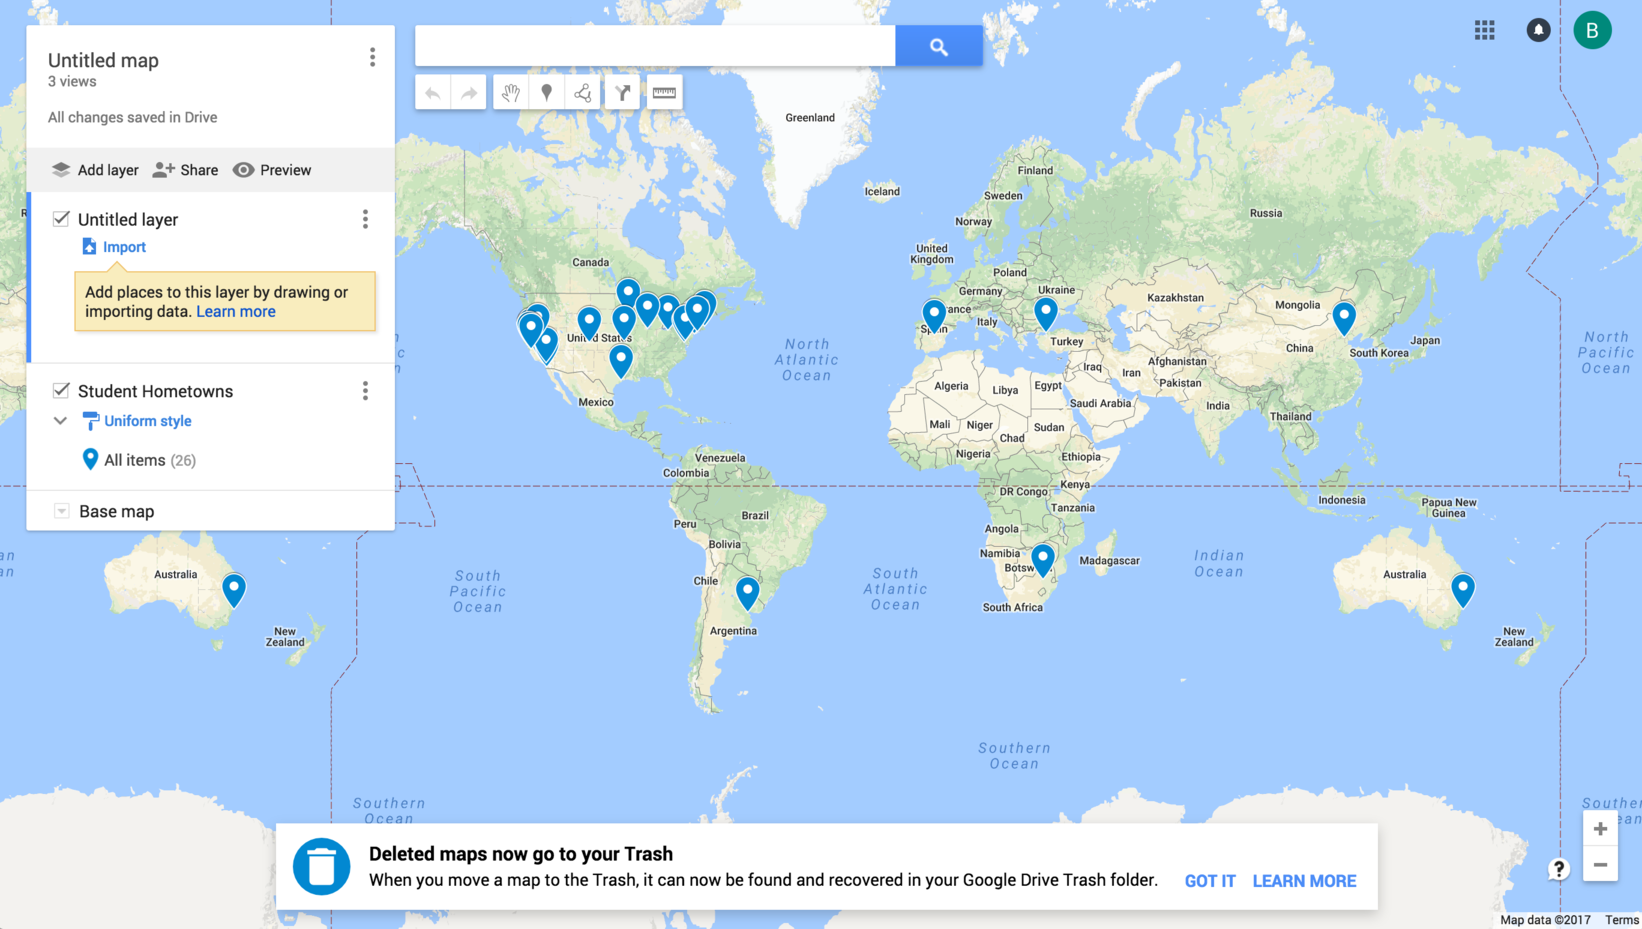
Hit finish and Google will automagically generate your map with the appropriate markers.
Here’s what one of the markers looks like up close.
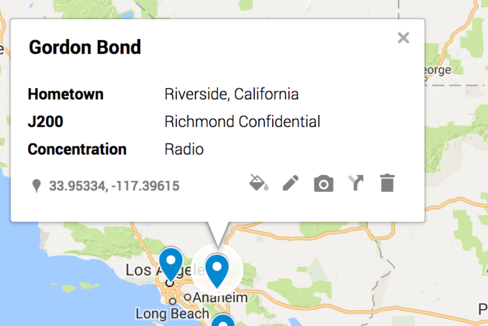
Note, the markers have all the information we had in our spreadsheet: name, hometown, J200, and concentration.
Adjusting styles
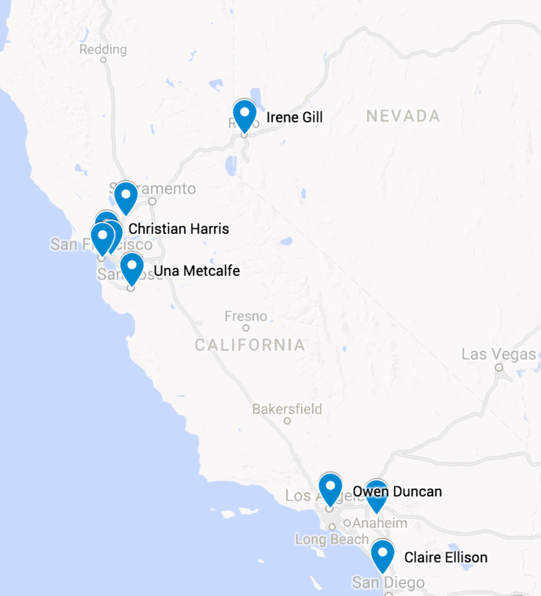
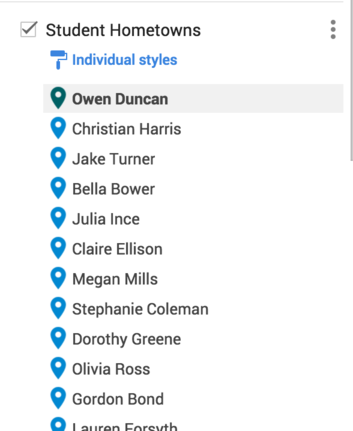
Looking at our newly created map, notice that all our markers are exactly the same style: a blue pin.
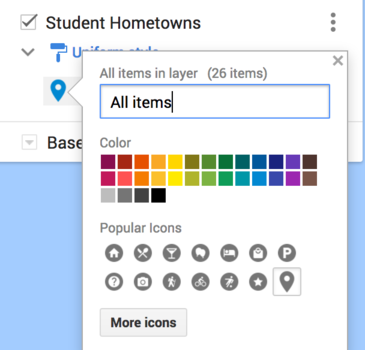
You can easily adjust the style of all of the markers at once by going to the layer we just created (it should now be titled “Student Hometowns”), hovering over “All Items” and clicking the paint bucket on the right. You’ll see different colors and icons that you can choose from.
You can also add labels to your markers as well. To do so, click on “Uniform style” underneath the “Student Hometowns” layer. You’ll see a dropdown menu called Set Labels with different label options to choose from.
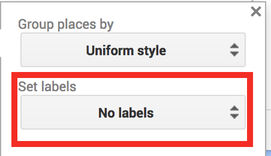
Try selecting “Name” to see each student’s name added to the map.
But what happens if you want to change the style of just some of the markers?
There are a couple of different options, depending on what you want to do.
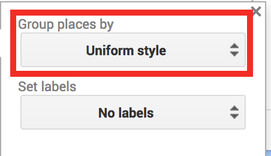
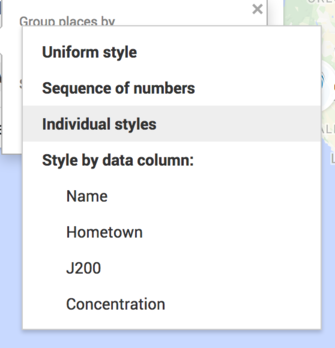
If you want to change the style of each individual marker, in the “Student Hometowns” layer, click on the “Group places by” dropdown menu.
In the popup that appears, select “Individual styles” from the menu.
This allows you to select markers one by one and change its color or icon style.
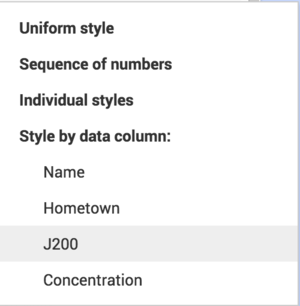
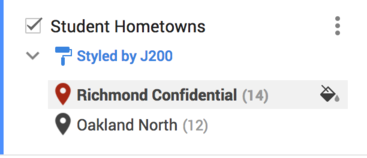
Now, what if we want each J200 group to have its own color on the map? To do so, we have to change the markers as a group. In the same menu, scroll down to the “Style by data column” option and select “J200.”
Google will automatically choose two different colors for each J200 group. If you want to change the color or icon style for each of the groups – say you want to make Oakland North dark gray and Richmond Confidential red – just hover over each group and click the paint bucket to customize.
Embedding on your site
So…you’ve played around with your map and made it just how you want it and now you want to put it on your website. What do you do?
First, you’ll want to make sure your map is publication-ready. Make sure to give your map a title. Let’s call ours “UCBSOJ Student Hometowns.” You can add a description to the map as well.
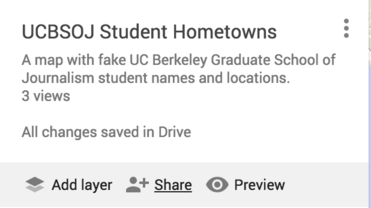
At this point, you may want to take a look at what your map will look like when you publish it. To do so, click the “preview” button on the layers box. A new window will open with a preview of your map.
Next you’ll need to share the map publicly. Do this by clicking the “share” button on the layers box and changing link sharing to “public.”

Last, you’ll want to grab the embed code. To do so, click the three dots on the right hand side of the layers box, and find “Embed on my site.”
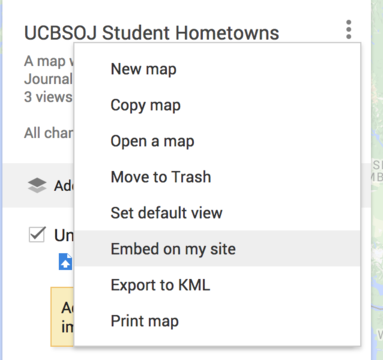
Copy and paste the HTML into the source code of your website and you’re set!
About This Tutorial
This tutorial was written by Briana Flin.
Republishing Policy
This content may not be republished in print or digital form without express written permission from Berkeley Advanced Media Institute. Please see our Content Redistribution Policy.