Maps are a key tool for visualizing data, but they have their limits. Consider these articles on why it can be problematic, a potential alternative, and a contest to enter if you’re up to the challenge this week.
Misleading Maps
 This New York Times Opinion piece: Election Maps Are Everywhere. Don’t Let Them Fool You explores poor design and data choices that make for bad election maps. It gets to the heart of the difficulties associated with visualizing election results in the U.S., with problems associated with area vs. population, color, and polarization. Slide through different iterations to find solutions to representation without misleading effects.
Read more on mapping attempts with There Are Many Ways To Map Election Results. We’ve Tried Most Of Them.
Enter the Cartogram
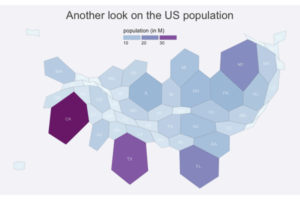 If maps can be tricky data visualization tools, the cartogram can be an alternative. From Data to Viz gives this definition: “A cartogram is a map in which the geometry of regions is distorted in order to convey the information of an alternate variable. The region area will be inflated or deflated according to its numeric value.” Find examples, variations and information on how to build in R or Python. Or if you prefer, check out this article from ESRI.
Enter to win #electionmapping
 If you’re ready, enter this Election Mapping Challenge from Mapbox. “Create your own interactive map, data visualization, or application related to local or national election-related issues.” Deadline to submit is November 8.
Want to learn how to effectively use data for storytelling purposes? Sign up for our new Online Data Visualization course starting on January 25th.
Find these resources helpful? Sign up for our newsletter for updates on our courses and up-to-date resources. Follow our socials and let us know how we can assist you along your professional journey.
![]()
![]()