Data Visualization
Real Estate Records Glossary

This tutorial contains a list of common terms used in real estate records that can be useful for making sense of the records. abstract of title: a summary or condensation of the essential parts of all recorded instruments which affect a particular piece of real estate, arranged in the order in which they were recorded.…
Read MoreHow To Make A Relief Map Using Blender

To make a relief map using Blender, you’ll need to fist install a few tools. The first are some command line utilities in a package called Gdal. The easiest way to install these on a Mac is by first installing the homebrew package manager. Install Homebrew (Mac) You can see the instructions to install homebrew on…
Read MoreData Visualization Glossary
Terms and definitions can lay the foundation for understanding larger concepts and practical applications within Data Visualization. The following data visualization glossary contains a few important ideas to know when starting to work with data. Basic Terms & Definitions Data Visualization: The graphical representation of information. Data is encoded into elements like length, slope,…
Read MoreCreate Custom Maps in Google Maps
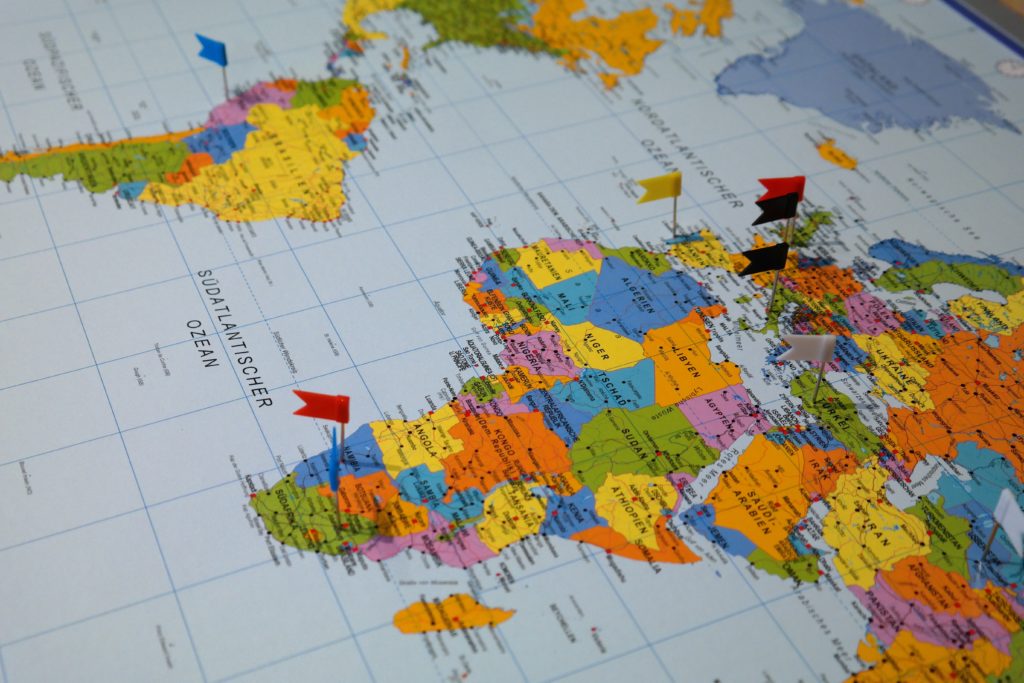
How To Create Custom Maps using Google Maps In this tutorial, you’ll learn how to create a map using Google Maps; how to customize that map manually or by importing data from a spreadsheet; and how to publish it on your site. Create a basic map Start by heading to maps.google.com. Click on the menu icon…
Read MoreDatabases of Statistical Information

Databases of Statistical Information A wealth of demographic and other data is available on a city, county, state and national level in the United States. But navigating the maze of government and private agencies that collect data to find statistics on a particular topic is often daunting. This guide lists the websites of major US…
Read MoreQGIS basics for Journalists
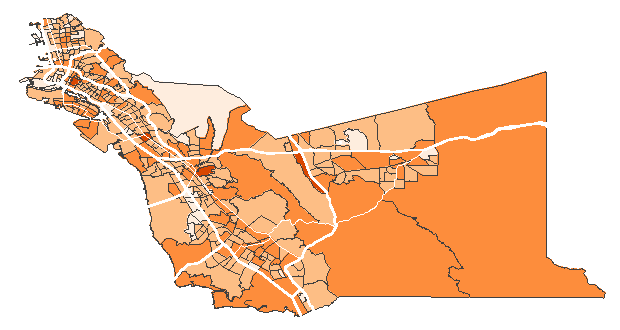
Tutorial: QGIS basics for Journalists By Len De Groot Introduction QGIS is a free, open source GIS application for Windows and Mac that provides a great starting point for journalists who want to learn to explore data with maps. Understanding how to visualize map data is an important skill but it can be intimidating. This…
Read More